1
2
3
4
5
6
7
8
9
10
11
12
13
14
15
16
17
18
19
20
21
22
23
24
25
26
27
28
29
30
31
32
33
34
35
36
37
38
39
40
41
42
43
44
45
46
47
48
49
50
51
52
53
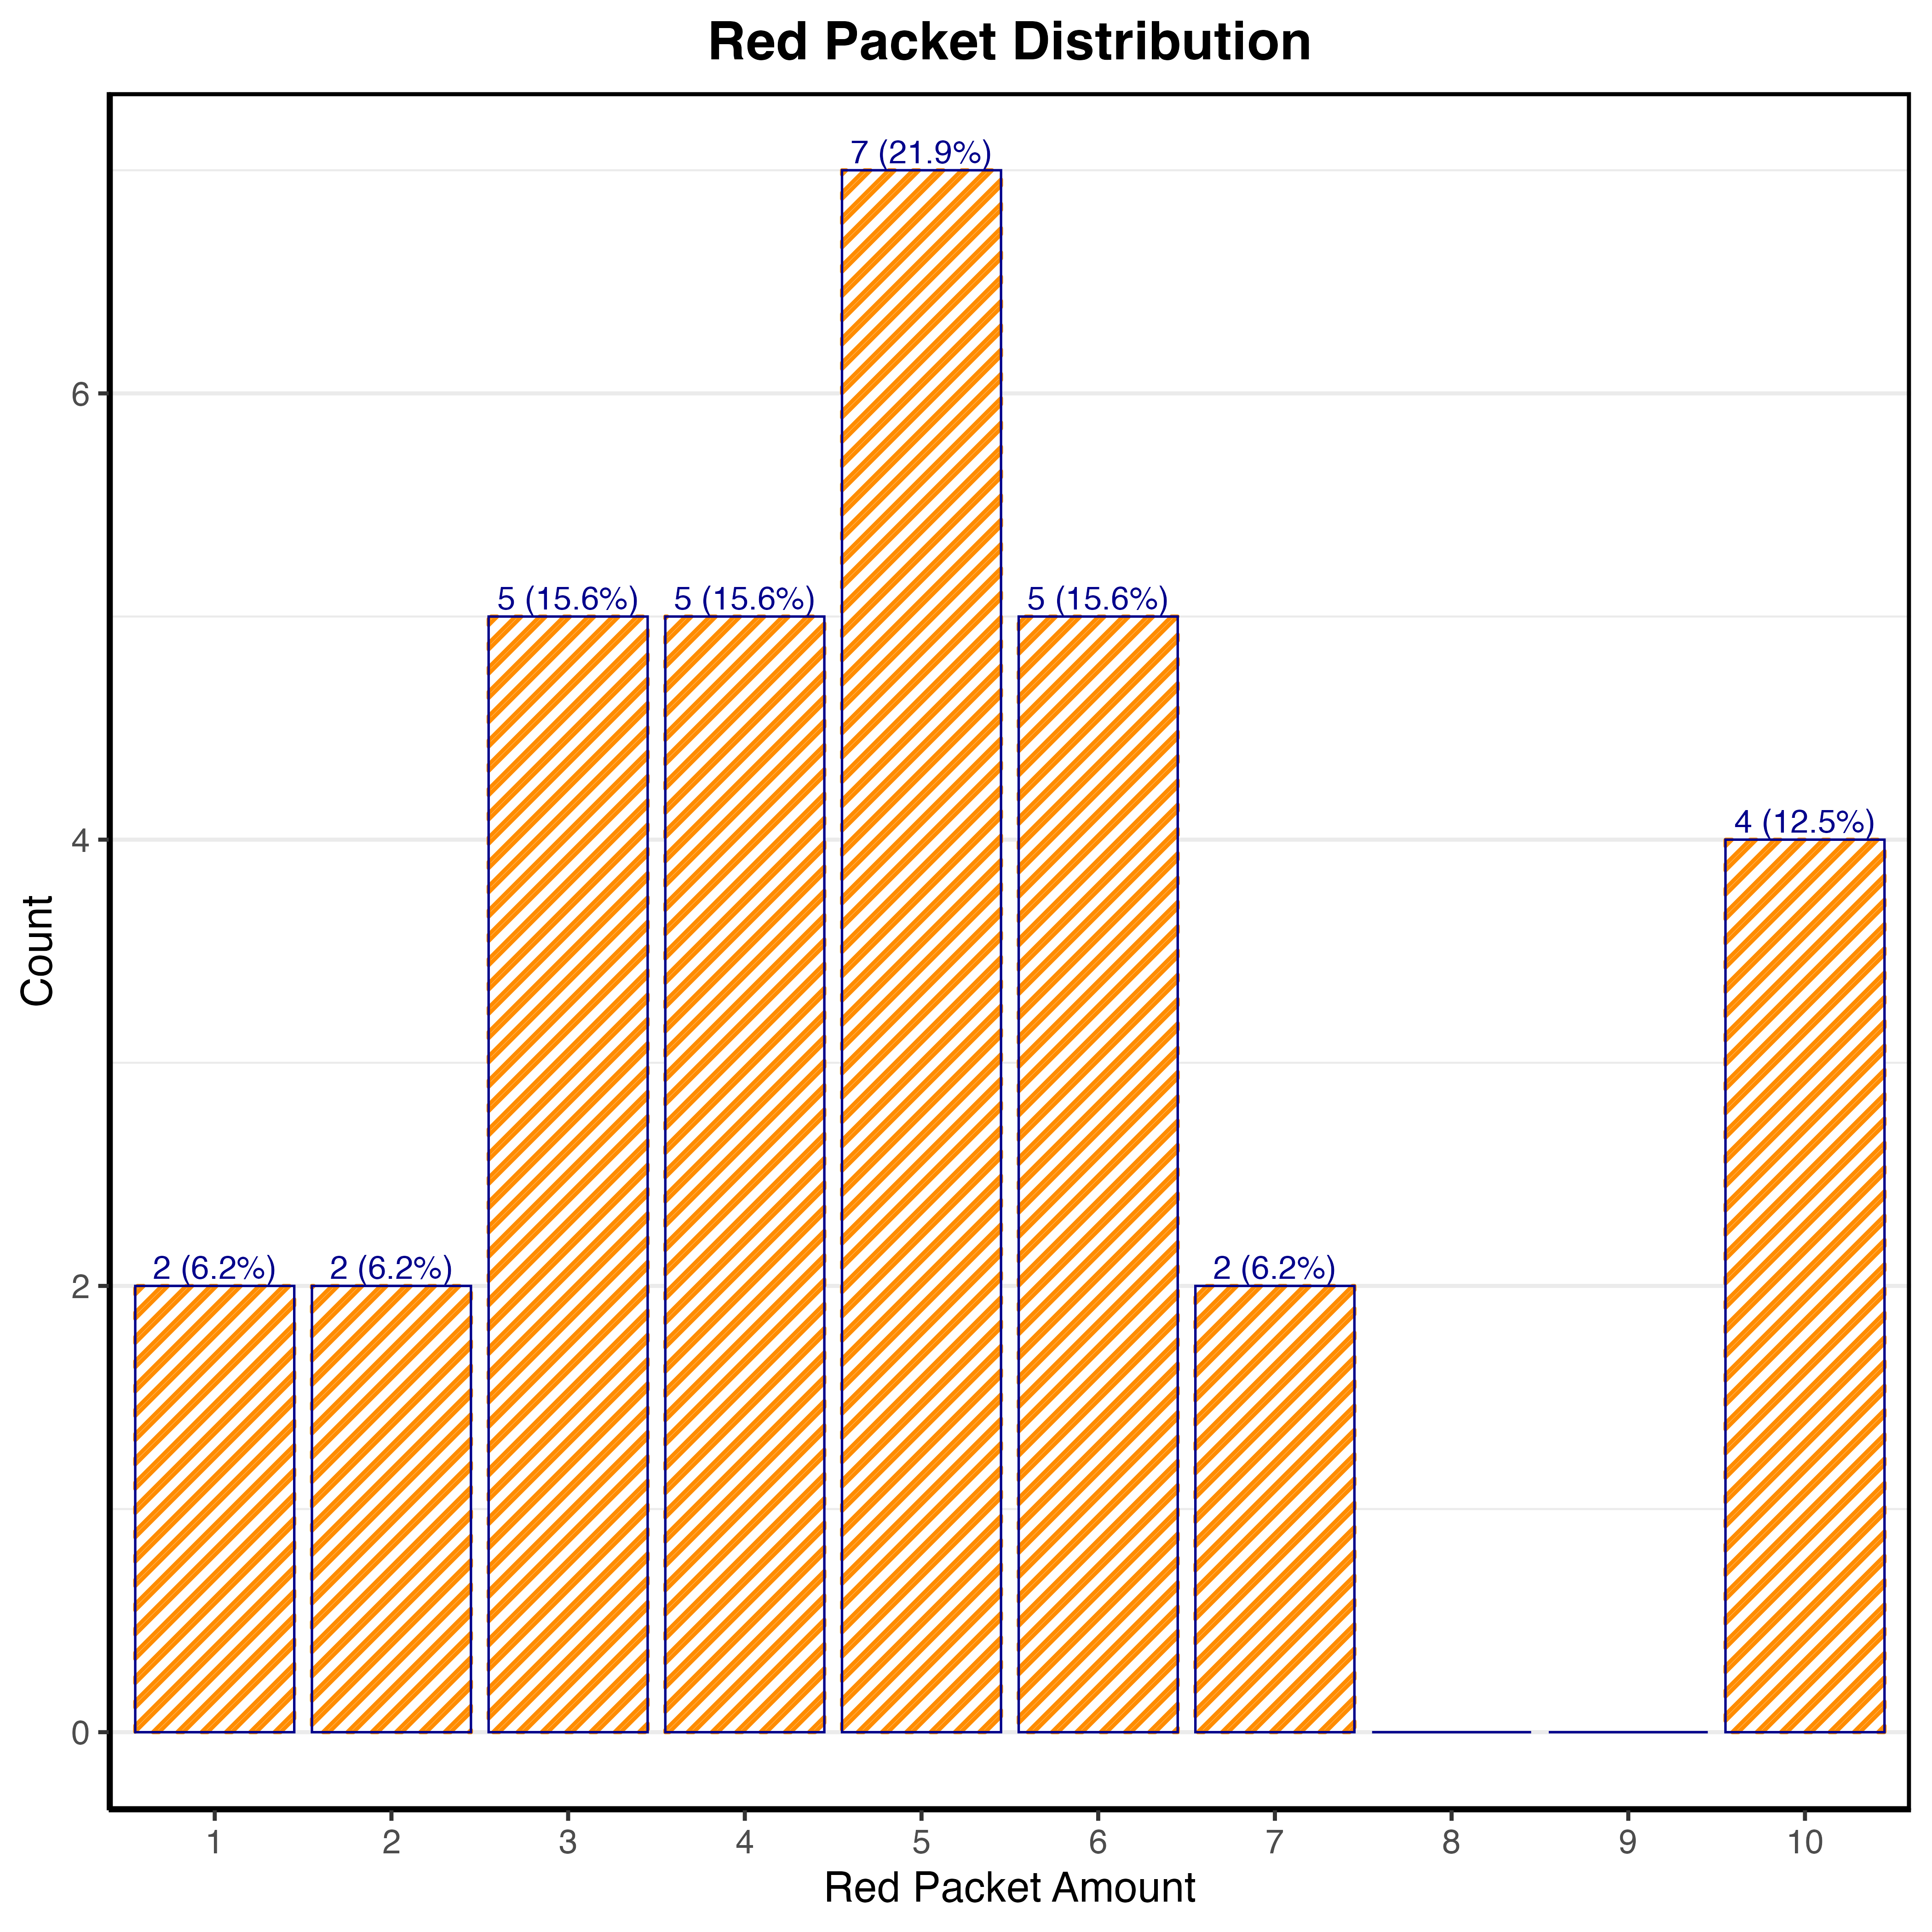
| library(ggplot2)
library(ggpattern)
red_packet_amount <- c(1, 2, 3, 4, 5, 6, 7, 8, 9, 10)
red_packet_number <- c(2, 2, 5, 5, 7, 5, 2, 0, 0, 4)
red_data <- data.frame(
amount = red_packet_amount,
count = red_packet_number
)
total <- sum(red_data$count)
red_data$percentage <- round(red_data$count / total * 100, 1)
red_data$label <- ifelse(
red_data$count == 0,
"",
sprintf("%d (%.1f%%)", red_data$count, red_data$percentage)
)
column_plot = ggplot(red_data, aes(x = factor(amount), y = count)) +
geom_col_pattern(
fill = "white",
pattern = "stripe",
pattern_fill = "white",
pattern_color = "darkorange",
pattern_density = 0.25,
pattern_spacing = 0.01,
pattern_angle = 45,
color = "darkblue",
linewidth = 0.3
) +
geom_text(
aes(label = label),
vjust = -0.3,
size = 3,
color = "darkblue"
) +
labs(
title = "Red Packet Distribution",
x = "Red Packet Amount",
y = "Count"
) +
theme_bw() +
theme(
panel.border = element_rect(color = "black", fill = NA, linewidth = 1),
axis.line = element_line(color = "black", linewidth = 0.5),
panel.grid.major.x = element_blank(),
plot.title = element_text(
hjust = 0.5,
size = 14,
face = "bold"
)
)
ggsave("Red_Packet_Distribution.png", plot = column_plot, dpi = 600)
|